How does UPLIFY scale Google Shopping for a CCTV store on Horoshop?

UPLIFY launched Google Shopping from zero for a CCTV / video-surveillance store on Horoshop and ran it for 12 months: ₴442,951 budget produced ₴5,426,457 (~$129K) revenue — ROAS 12.25×, 1,734 purchases, ACoS 8.32%, 10.98M impressions. Stack: feed-first PMax with price/category segmentation, asset-driven expansion, daily controls + weekly deep optim.

Google AdsPerformance MaxHoroshopROASGoogle Merchant CenterROAS 12.25×CCTV e-commercevideo surveillancefeed-first PMaxasset groupsACoSUPLIFY case studyUkraineQ139583119
← cases · Google Shopping · Security / CCTV
CASE · GOOGLE SHOPPING · HOROSHOP JAN — DEC 2023 ● real data

ROAS 12.25× on Horoshop:
PMax from zero
across one year.

PMax built from zero for a CCTV / video-surveillance store. Built a controlled model on priority product groups. 10.98M impressions · 1,734 purchases · stable economics over a one-year horizon.

ROAS
12.25×
1225% return
Revenue
₴5.43M
Google Ads · 1 year
Budget
₴443K
ACoS 8.32%
Purchases · CPA
1,734
CPA ≈ ₴255
client
CCTV store on Horoshop
vertical
E-commerce · security / technology
reporting period
January — December 2023 (12 months)
channel
Google Ads · Performance Max
model
feed-first · priority groups · asset scenarios
platform
Horoshop
/ tl;dr

case in 5 lines.

pmax-cctv-horoshop.json ● active
[01]foundation::Launch from zero — set up Analytics, Merchant Center, account structure
[02]budget::₴442,951 (~$10.5K) over 12 months
[03]revenue::₴5,426,457 revenue (~$129K) · ROAS 12.25× · 1,734 purchases
[04]metrics::CTR 1.27% · CR 1.01% · CPA ≈ ₴255 · ACoS 8.32%
[05]approach::feed-first strategy + PMax segmentation by price/category
$_
/ 01 · context and goal

from Google Ads launch from zero to selling priority product groups.

context

Google Ads launch from zero

We had to lay the foundation before launching: audit Analytics, Merchant Center, account structure. Without baseline infrastructure PMax would run blind.

goal

Sell priority product groups

Control budget and cut what isn't worth it. Show the right products to the right users so ROAS is predictable on a yearly horizon.

/ 02 · what we did · scroll

framework: foundation → PMax architecture → optimization.

STEP · 01FOUNDATION

Data foundation

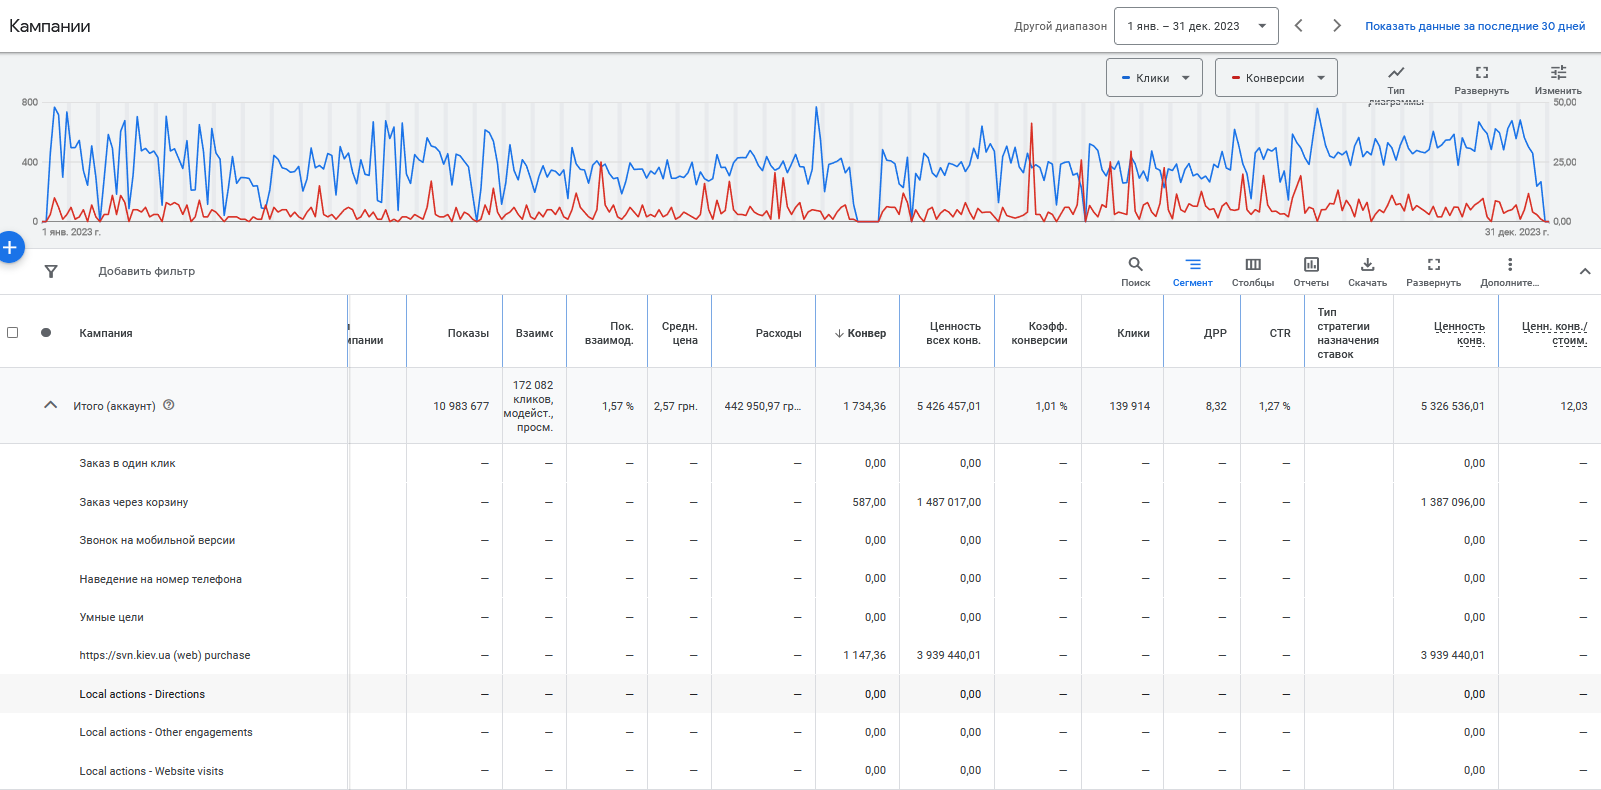
Audit + setup of GA4, Merchant Center, Google Ads.

  • Full audit of GA4, Merchant Center, Google Ads
  • GA4 setup + conversion-data pass-through validation
  • Resolved every issue we found before launch
GA4Merchant CenterAudit
STEP · 02PMAX ARCHITECTURE

PMax architecture

Price/category segmentation + feed-first.

  • Launched PMax campaigns
  • Segmented by price and product category
  • Feed-first strategy in the product feed
  • Asset-driven audience-expansion scenarios
PMaxFeed-firstSegmentationAsset groups
STEP · 03OPTIMIZATION

Year-long management

Daily control, weekly deep-optim, seasonal adaptation.

  • Systematic account management throughout the year
  • Monitored budget allocation across segments
  • Removed weak products / segments
  • Refined assets and ad copy
Daily controlWeekly optimFeed refreshSeasonal
/ 03 · results

result: ₴5.43M (~$129K) revenue from a ₴443K budget · ROAS 12.25× over 12 months.

10.98M impressions · stable economics over a yearly horizon

Reporting period
January — December 2023
Budget
₴442,951 (~$10.5K)
Revenue
₴5,426,457 (~$129K)
ROAS
12.25×
Purchases
1,734
CPA
≈ ₴255
CTR
1.27%
Conversion Rate
1.01%
Impressions
10,983,677
Clicks
139,914
ACoS
8.32%
/ proof from the dashboard
Google Ads · ROAS 12.25× · CoS 8.32% · revenue ₴5.43M (~$129K)
₴5.43M
revenue from ₴443K budget · ROAS 12.25× over 12 months
10.98M impressions · stable economics over a yearly horizon
/ 04 · frequently asked questions

setting up GOOGLE SHOPPING.

01What gets checked when launching PMax from zero?

Full audit: GA4 configuration, Merchant Center feed health, disapproved products, Google Ads structure — all before the campaign launches.

02Why segment PMax by price / category?

Segmentation lets you carve priority product groups into separate campaigns with their own budget and strategy — without diluting results.

03How is budget controlled across priorities?

Separate campaigns per segment with defined budgets. Regular analysis surfaces weak performers for exclusion and reallocation toward profitable segments.

04Why does PMax show €2.57 average cost per interaction, not per click?

PMax measures interactions (not just clicks) — including YouTube, Discovery, and other engagement types.

05Which metrics matter most for the owner?

ACoS (cost / revenue), ROAS, and CPA — held in place by systematic optimization.

06How often is the account optimized?

Daily — spend control; weekly — deep dive: product analysis, feed updates, asset refinement.

07How long does foundation work take before launch?

Typically 3–5 working days if accounts are clean. If Merchant Center has disapprovals — up to 10 days for fixes.

08Does this work for stores with small catalogs?

Yes — PMax also works for small catalogs. The segmentation logic just has to adapt — by margin rather than by price.

Get in touch

start with a
growth audit.

Describe the task in 2-3 sentences. We reply within the same business day. We will look at your accounts and show where you are growing and where you are losing money. Free. No commitment.

  1. 01/03
    Request

    Form or Telegram. We reply within the business day.

  2. 02/03
    Call or message · 24h

    30 min intro — your choice of channel: phone, Telegram, email.

  3. 03/03
    Free audit

    Growth-points map for 30/60/90 days, scope of work — free.

add details (optional)

Reply within the business day · no spam · no commitment

skip →